
yoooniverse
[kaggle] Learn Tutorial_Pandas 정리_1 본문
< 3 > Summary Functions and Maps
Pandas provides many simple "summary functions" notanofficialname which restructure the data in some useful way.
Summary functions
1. describe method
type-aware: its output changes based on the data type of the input.
#describe() method: type-aware
#shows an overview of the data
wine_reviews.points.describe()      # numerical data
wine_reviews.taster_name.describe() # string data
count 129971.000000 count 103727
mean 88.447138 unique 19
std 3.039730 top Roger Voss
min 80.000000 freq 25514
25% 86.000000 Name: taster_name, dtype: object
50% 88.000000
75% 91.000000
max 100.000000
Name: points, dtype: float642. mean, unique, value_counts
: to get some particular simple summary statistic about a column in DataFrame or Series
- mean
- unique: to see a list of unique values
- value_counts: to see a list of unique values & how often they occur in the dataset
#mean(), unique(), value_counts()
wine_reviews.points.mean()    #88.44713820775404
wine_reviews.taster_name.unique()   #array(['Kerin O’Keefe', 'Roger Voss', 'Paul Gregutt', ... , 'Christina Pickard'], dtype=object)
wine_reviews.taster_name.value_counts()
'''
Roger Voss            25514
Michael Schachner     15134
Kerin O’Keefe         10776
Virginie Boone         9537
Paul Gregutt           9532
Matt Kettmann          6332
Joe Czerwinski         5147
Sean P. Sullivan       4966
Anna Lee C. Iijima     4415
Jim Gordon             4177
Anne Krebiehl MW       3685
Lauren Buzzeo          1835
Susan Kostrzewa        1085
Mike DeSimone           514
Jeff Jenssen            491
Alexander Peartree      415
Carrie Dykes            139
Fiona Adams              27
Christina Pickard         6
Name: taster_name, dtype: int64
'''
Maps
a function that takes one set of values and "maps" them to another set of values.
1. map
수학의 합성 함수 개념과 같다
review_points_mean = wine_reviews.points.mean()
wine_reviews.points.map(lambda p: p - review_points_mean)

'''
0        -1.447138
1        -1.447138
2        -1.447138
3        -1.447138
4        -1.447138
            ...
129966    1.552862
129967    1.552862
129968    1.552862
129969    1.552862
129970    1.552862
Name: points, Length: 129971, dtype: float64
'''
2. apply
the equivalent method if we want to transform a whole DataFrame by calling a custom method on each row.
def remean_points(row):
  row.points = row.points - review_points_mean
  return row

wine_reviews.apply(remean_points, axis='columns')
apply 파라미터 axis='index'
: instead of passing a function to transform each row, we would need to give a function to transform each column.
🚨 map and apply return new, transformed Series and DataFrames, respectively.
🚨 They don't modify the original data they're called on.
+) additional mapping operations
review_points_mean = wine_reviews.points.mean()
wine_reviews.points - review_points_mean


'''
0        -1.447138
1        -1.447138
2        -1.447138
3        -1.447138
4        -1.447138
            ...
129966    1.552862
129967    1.552862
129968    1.552862
129969    1.552862
129970    1.552862
Name: points, Length: 129971, dtype: float64
'''
🐧 Maps allow us to transform data in a DataFrame or Series one value at a time for an entire column.
< 4> Grouping and Sorting
we want to group our data, and then do something specific to the group the data is in.
Grouping
1. groupby
reviews.groupby('points').points.count()operation:
- Create a group of reviews which allotted the same point values to the given wines.
- For each of these groups, grab the "points" column and count how many times it appeared
🔑 value_count is a shortcut to this operation
🔑 groupby can be used at any summary functions
groupby 응용
- 각 포인트 점수마다 가장 작은 price를 가져옴

reviews.groupby('points').price.min()
# to get the cheapest wine in each point value category
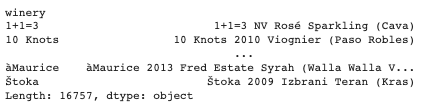
- 와이너리 별 리뷰 순서가 가장 첫번째인 와인의 title 정보를 가져옴
reviews.groupby('winery').apply(lambda df: df.title.iloc[0])
# one way of selecting the name of the first wine reviewed from each winery in the dataset
- groupby에 여러 컬럼 값을 넣어도 가능
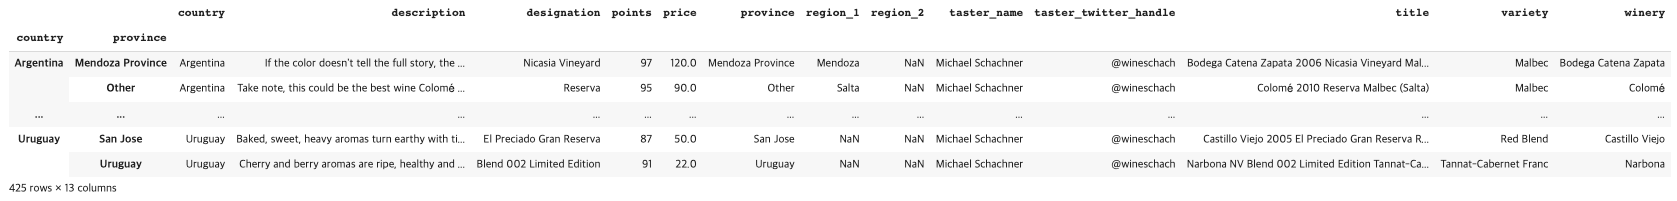
reviews.groupby(['country', 'province']).apply(lambda df: df.loc[df.points.idxmax()]
# picking out the best wine by country and province
country와province별포인트가가장높은와인의row정보를가져옴
2. agg
It lets you run a bunch of different functions on your DataFrame simultaneously
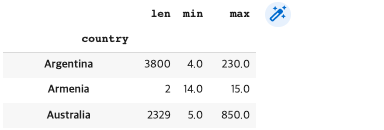
reviews.groupby(['country']).price.agg([len, min, max])
# can generate a simple statistical summary of the dataset
나라별 len, min, max 값을 보여준다.len:그나라와인이몇개인지,min:그나라와인중가장낮은가격,max:그나라와인중가장높은가격
3. multi-indexes
A multi-index differs from a regular index in that it has multiple levels.
require two levels of labels to retrieve a value.
https://pandas.pydata.org/pandas-docs/stable/user_guide/advanced.html
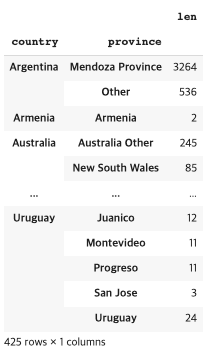
countries_reviewed = reviews.groupby(['country', 'province']).description.agg([len])
countries_reviewed
가장 많이 사용하게 될 멀티-인덱스 메소드 : reset_index
countries_reviewed.reset_index()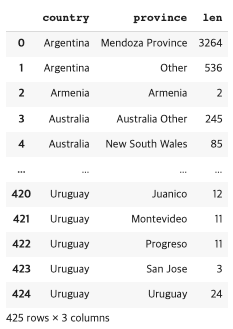
🐧 when outputting the result of a groupby, the order of the rows is dependent on the values in the index, not in the data.
Sorting
1. sort_values
1 defaults to an ascending sort, where the lowest values go first
2 to make descending sort, we use 'ascending = False'
3 to sort by index, use companion method 'sort_index
countries_reviewed = countries_reviewed.reset_index()
countries_reviewed.sort_values(by='len')
countries_reviewed.sort_values(by='len', ascending=False)
countries_reviewed.sort_index()
countries_reviewed.sort_values(by=['country', 'len'])
'KAGGLE > Pandas' 카테고리의 다른 글
| [kaggle] Learn Tutorial_Pandas 정리_0 1 | 2022.11.11 |
|---|
