
yoooniverse
[kaggle] Learn Tutorial_Intro to Machine Learning (정리)_0 본문
[kaggle] Learn Tutorial_Intro to Machine Learning (정리)_0
Ykl 2022. 11. 2. 23:28Learn Intro to Machine Learning Tutorials
Learn the core ideas in machine learning, and build your first models.
www.kaggle.com
시나리오:
부동산 투자로 큰 돈을 번 cousin. data science에 관심있는 나에게 비즈니스 파트너가 되어줄 것을 제안.
사촌은 돈을 조달하고, 나는 모델을 제공한다. 어떤 모델? 다양한 주택의 가치를 예측하는 모델
사촌은 어떻게 부동산 투자로 돈을 벌었는가?
과거에 봤던 주택들의 가격 변화 패턴을 파악하고, 이 패턴을 적용해 새로운 주택의 가격에 대한 prediction을 한다.
MODEL: Decision Tree

any house under consideration:
historical average price of houses in the same category의 predicted price
- fitting/training the model: the step of capturing patterns from data
- training data: The data used to fit the model
If the model has been fit, apply it to new data to predict the price
👈 It doesn't capture most factors affection home price(방 개수, 집 위치 등)
해당 decision tree에 split을 추가하여 deeper trees로 만들면 된다.

You predict the price of any house by tracing through the decision tree, always picking the path corresponding to that house's characteristics.
👈 leaf: bottom of the decision tree. where we make a prediction
DATA EXPLORATION
Pandas library 👈 Data Frame과 깊은 연관.
import pandas as pd
melbourne_file_path = '파일 경로 삽입'
melbourne_data = pd.read_csv(melbourne_file_path)
melbourne_data.describe()
파일 경로에 들어있는 csv 파일을 pd.read_csv()함수로 읽어온 후,
csv 파일의 정보를 담고 있는 내용을 뽑아 관찰해보자

- count: number of rows that have non-missing values
- mean: average
- std: standard deviation(표준편차)자료가 펼쳐져 있는 유형에 대한 정보
- min, 25%, 50%, 75%, max: 자료의 사분위값 제공
Selecting Data for Modeling
간단한 전처리
melbourne_data = melbourne_data.dropna(axis=0) #axis=0 : 행 제거, axis=0 : 열 제거해당 튜토리얼에서 사용한 데이터는 missing value들이 좀 있음. 해당 코드를 통해 값이 없는 행들은 지워지도록 한다.
Selecting The Prediction Target & Choosing "Features"
y = melbourne_data.Price

melbourne_features = ['Rooms', 'Bathroom', 'Landsize', 'Lattitude', 'Longtitude']
X = melbourne_data[melbourne_features]
X.describe()
X.head()	#데이터 테이블의 맨 앞 5줄만 뽑아서 보여줌
y: prediction target 👉 데이터 프레임의 'Price' column을 target 값으로 설정.
X: Features) model의 input으로 사용할 colums들을 지칭
Building Your Model
Scikit-learn 라이브러리 사용
* Scikit-learn is easily the most popular library for modeling the types of data typically stored in DataFrames
The steps to building and using a model are:
- Define: What type of model will it be? A decision tree? Some other type of model? Some other parameters of the model type are specified too.
- Fit: Capture patterns from provided data. This is the heart of modeling.
- Predict: Just what it sounds like
- Evaluate: Determine how accurate the model's predictions are.
from sklearn.tree import DecisionTreeRegressor

# Define model. Specify a number for random_state to ensure same results each run
melbourne_model = DecisionTreeRegressor(random_state=1)

# Fit model
melbourne_model.fit(X, y)random_state = 1
random_state 옵션을 고정해 만들어진 트리를 같은 조건으로 비교합니다.
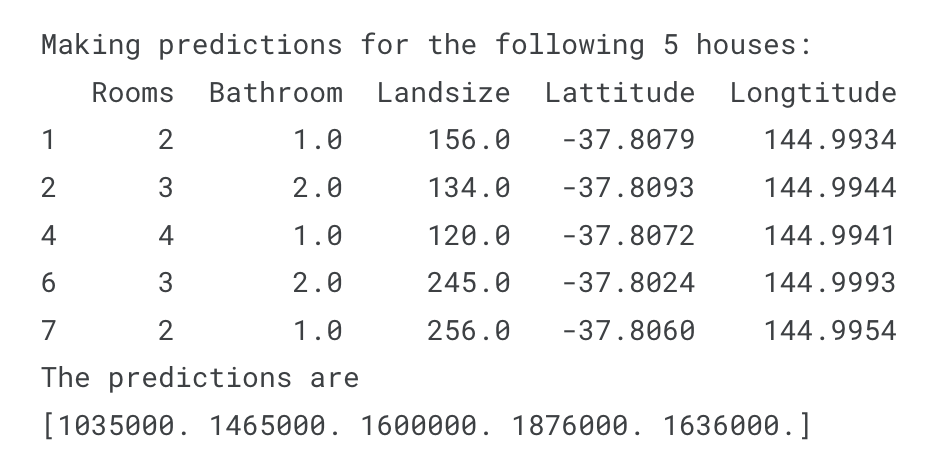
print(X.head())
print(melbourne_model.predict(X.head()))
print(y.head())
input data의 head(), 상위 5개 행의 값으로만 predict 한 후 결과를 예측
예측한 predict 값과 target 값으로 설정한 y값들을 비교하며 prediction의 정확성을 판단하기
🐧 여기까지의 코드 전문
import pandas as pd
melbourne_file_path = '파일 경로 삽입'
melbourne_data = pd.read_csv(melbourne_file_path)
melbourne_data.describe()

melbourne_data = melbourne_data.dropna(axis=0) #axis=0 : 행 제거, axis=0 : 열 제거

y = melbourne_data.Price

melbourne_features = ['Rooms', 'Bathroom', 'Landsize', 'Lattitude', 'Longtitude']
X = melbourne_data[melbourne_features]
X.describe()
X.head()	#데이터 테이블의 맨 앞 5줄만 뽑아서 보여줌


from sklearn.tree import DecisionTreeRegressor

melbourne_model = DecisionTreeRegressor(random_state=1)
melbourne_model.fit(X, y)


print(X.head())
print(melbourne_model.predict(X.head()))
print(y.head())'KAGGLE > Intro to Machine Learning' 카테고리의 다른 글
| [kaggle] Learn Tutorial_Intro to Machine Learning (정리)_3(실습코드) (0) | 2022.11.05 |
|---|---|
| [kaggle] Learn Tutorial_Intro to Machine Learning (정리)_2 (0) | 2022.11.04 |
| [kaggle] Learn Tutorial_Intro to Machine Learning (정리)_1 (0) | 2022.11.03 |
